Understanding Psychographic Differences Between Registered and Unregistered Voters
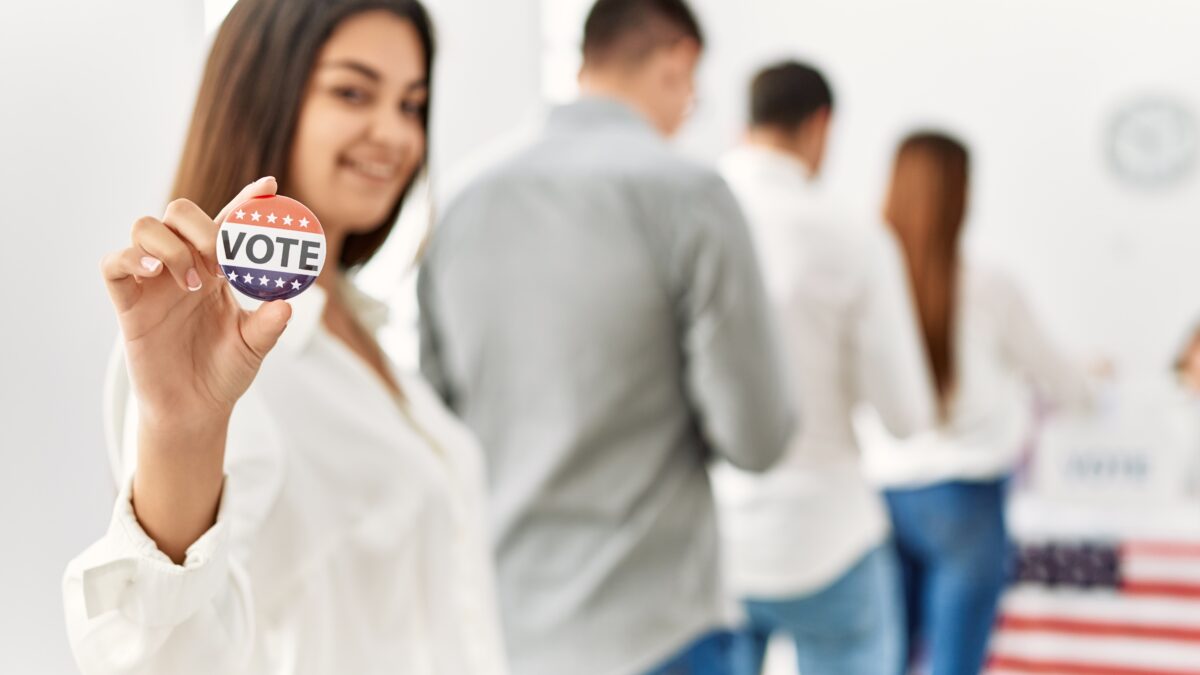
In the United States, presidential elections are pivotal moments that shape the nation’s future. Voting is not just a right; it’s a responsibility. Each individual vote carries immense weight, contributing to the collective voice that influences policy decisions, leadership transitions, and the very fabric of democracy. Americans of all demographics, either from a small town or urban area or a first-time voter vs a seasoned citizen, have a voice that matters.
However, according to recent MRI-Simmons USA Study data, only 2 in 3 American adults are registered to vote. Knowing who these potential voters are, how to reach them, and how to get more of them may be crucial for improving US policies and implementing systemic change.
Registered Voters: Who are They?
67% of American adults – 171 million people – are registered to vote in the US. Compared to unregistered Americans, registered voters skew older (median age 53, index 136), college educated (39%, 144), and affluent (median household income $94K, 136). They are more likely to live in the Midwest and Northeast regions, with 73% of Midwesterners and 68% of Northeasterners being registered. Michigan (82%, 123) and Connecticut (77%, 115) have the highest rates of voter registration compared to other states.
Attitudinally, registered voters are more likely than unregistered Americans to feel perfectly happy with their standard of living (81%, 108), think they are more capable than others (70%, 106), and believe worrying about the future is a waste of time (45%, 104). They value continual learning through life (95%), spending a quiet evening at home (88%), and keeping their circle small with only a few close friends (88%).
When it comes to politics, registered voters place higher importance on social issues that are relevant to them (a population that skews older and more affluent), such as preserving social security (24%), gun issues (20%), and immigration reform (19%). Registered voters are less likely to think LGBTQ rights, racial justice, or income equality are important. Party wise, they’re split – 34% Democratic, 33% Independent, and 32% Republican – however, they skew slightly for having a more conservative political outlook compared to the average American (107).
7 in 10 registered voters always vote in national elections, while another 1 in 10 sometimes vote, so polling places can expect most of this population to participate this November. In fact, over 90% of registered voters claim they plan to cast a ballot this year – 37% for Joe Biden and 38% for Donald Trump.
Unregistered Americans: Understanding the Gap
The other 86 million Americans (33%) are unregistered. Compared to registered voters, this population skews younger (median age 39, index 74), Hispanic (29%, 252), single (41%, 160), and having a high school education (50%, 149). They are more likely to live in the West and South regions, with 37% of Westerners and 35% of Southerners not being registered to vote in the US.
Compared to their registered counterparts, they are more likely to be stressed by their daily commute (140), feel connected to their heritage (134), like to stand out in a crowd and show off what they have (134), and put career ahead of family (132). They want to start their own businesses and make it to the top of their professions (131).
Politically, they over index for believing LGBTQ rights (9%, 128), racial justice (9%, 127), and education (12%, 121) are top social issues that need to be addressed in this year’s election. Unregistered Americans’ political outlook falls in the middle of the two opposing sides, with 57% identifying as Independents (172) and 46% having a “middle of the road” perspective (129). In fact, they fall in the middle on political issues like pro-choice vs pro-life and immigration rights vs closing US borders. Having non-partisan perspectives on rivaling issues makes unregistered Americans an appealing audience; they are swayable, with 22% self-identifying as being “easily swayed by other peoples’ views” (129).
So what’s keeping them from registering to vote? One reason could be that over 2 in 5 unregistered Americans believe new voting laws will make it hard for them to vote (41%, 129). They could be concerned about obstacles such as restrictive voter ID laws, which disproportionately impact Black, Hispanic, and young people – demographics that skew unregistered. Another reason is likely that over 2 in 3 unregistered Americans are fed up with both the Democrat and Republican parties (67%), and 65% believe no political candidate represents their views well.
Surprisingly (and to campaigners’ delight), 50% of unregistered Americans – 43 million adults – plan to get involved in political activities this year. 15% plan to attend a town hall, 13% plan to contact an elected official, and 13% plan to donate to a campaign. In fact, unregistered Americans are more likely than registered voters to plan to attend a fundraising event (8%, 138), join a political party (9%, 133), and participate in a debate (9%, 121). Will this increased involvement result in more voter registrations before November? Candidates can hope.
New Voters: Where and How to Reach Them
For over 16 million Americans (7%), November will be the first Presidential election in which they are eligible to vote, and less than half are registered (46%).
18- to 21-year-olds are more likely than the average American to be willing to call out a company that doesn’t align with their socio-political values (56%, 128), be willing to change careers to focus on saving the environment (57%, 126), and like when celebrities speak up on social issues (66%, 124). They over index on plans to participate in nearly every political activity this year, such as attending fundraising events (214), joining a political party (157), and participating in a protest (154). According to the data, potential new voters’ interest in politics is undeniable, yet 1 in 4 already claim they do not plan to vote this November (23%, 207).
For marketers and advertisers looking to influence this group, it’s good news that 18- to 21-year-olds are more likely to think ads paint a true picture of what’s being advertised (34%, 136) and like looking at ads (31%, 121). Also, they learn about candidates from podcasts (52%, 136) and through ads (57%, 112). The top places to find potential new voters are YouTube (75%, 131), Netflix (75%, 114), Instagram (65%, 166), and TikTok (55%, 213). Campaigns can collaborate with influencers, from celebrities to community leaders, to promote voter registration, simplify the process for new voters, and debunk misconceptions since over half of 18- to 21-year-olds believe laws will make it hard for them to vote (52%, 149).
Conclusion: Every Vote Counts
Voting in the Presidential election this year is crucial to voice opinions that shape society, protect voting rights that Americans have fought for over centuries, and ensure democracy remains strong and representative of all Americans.
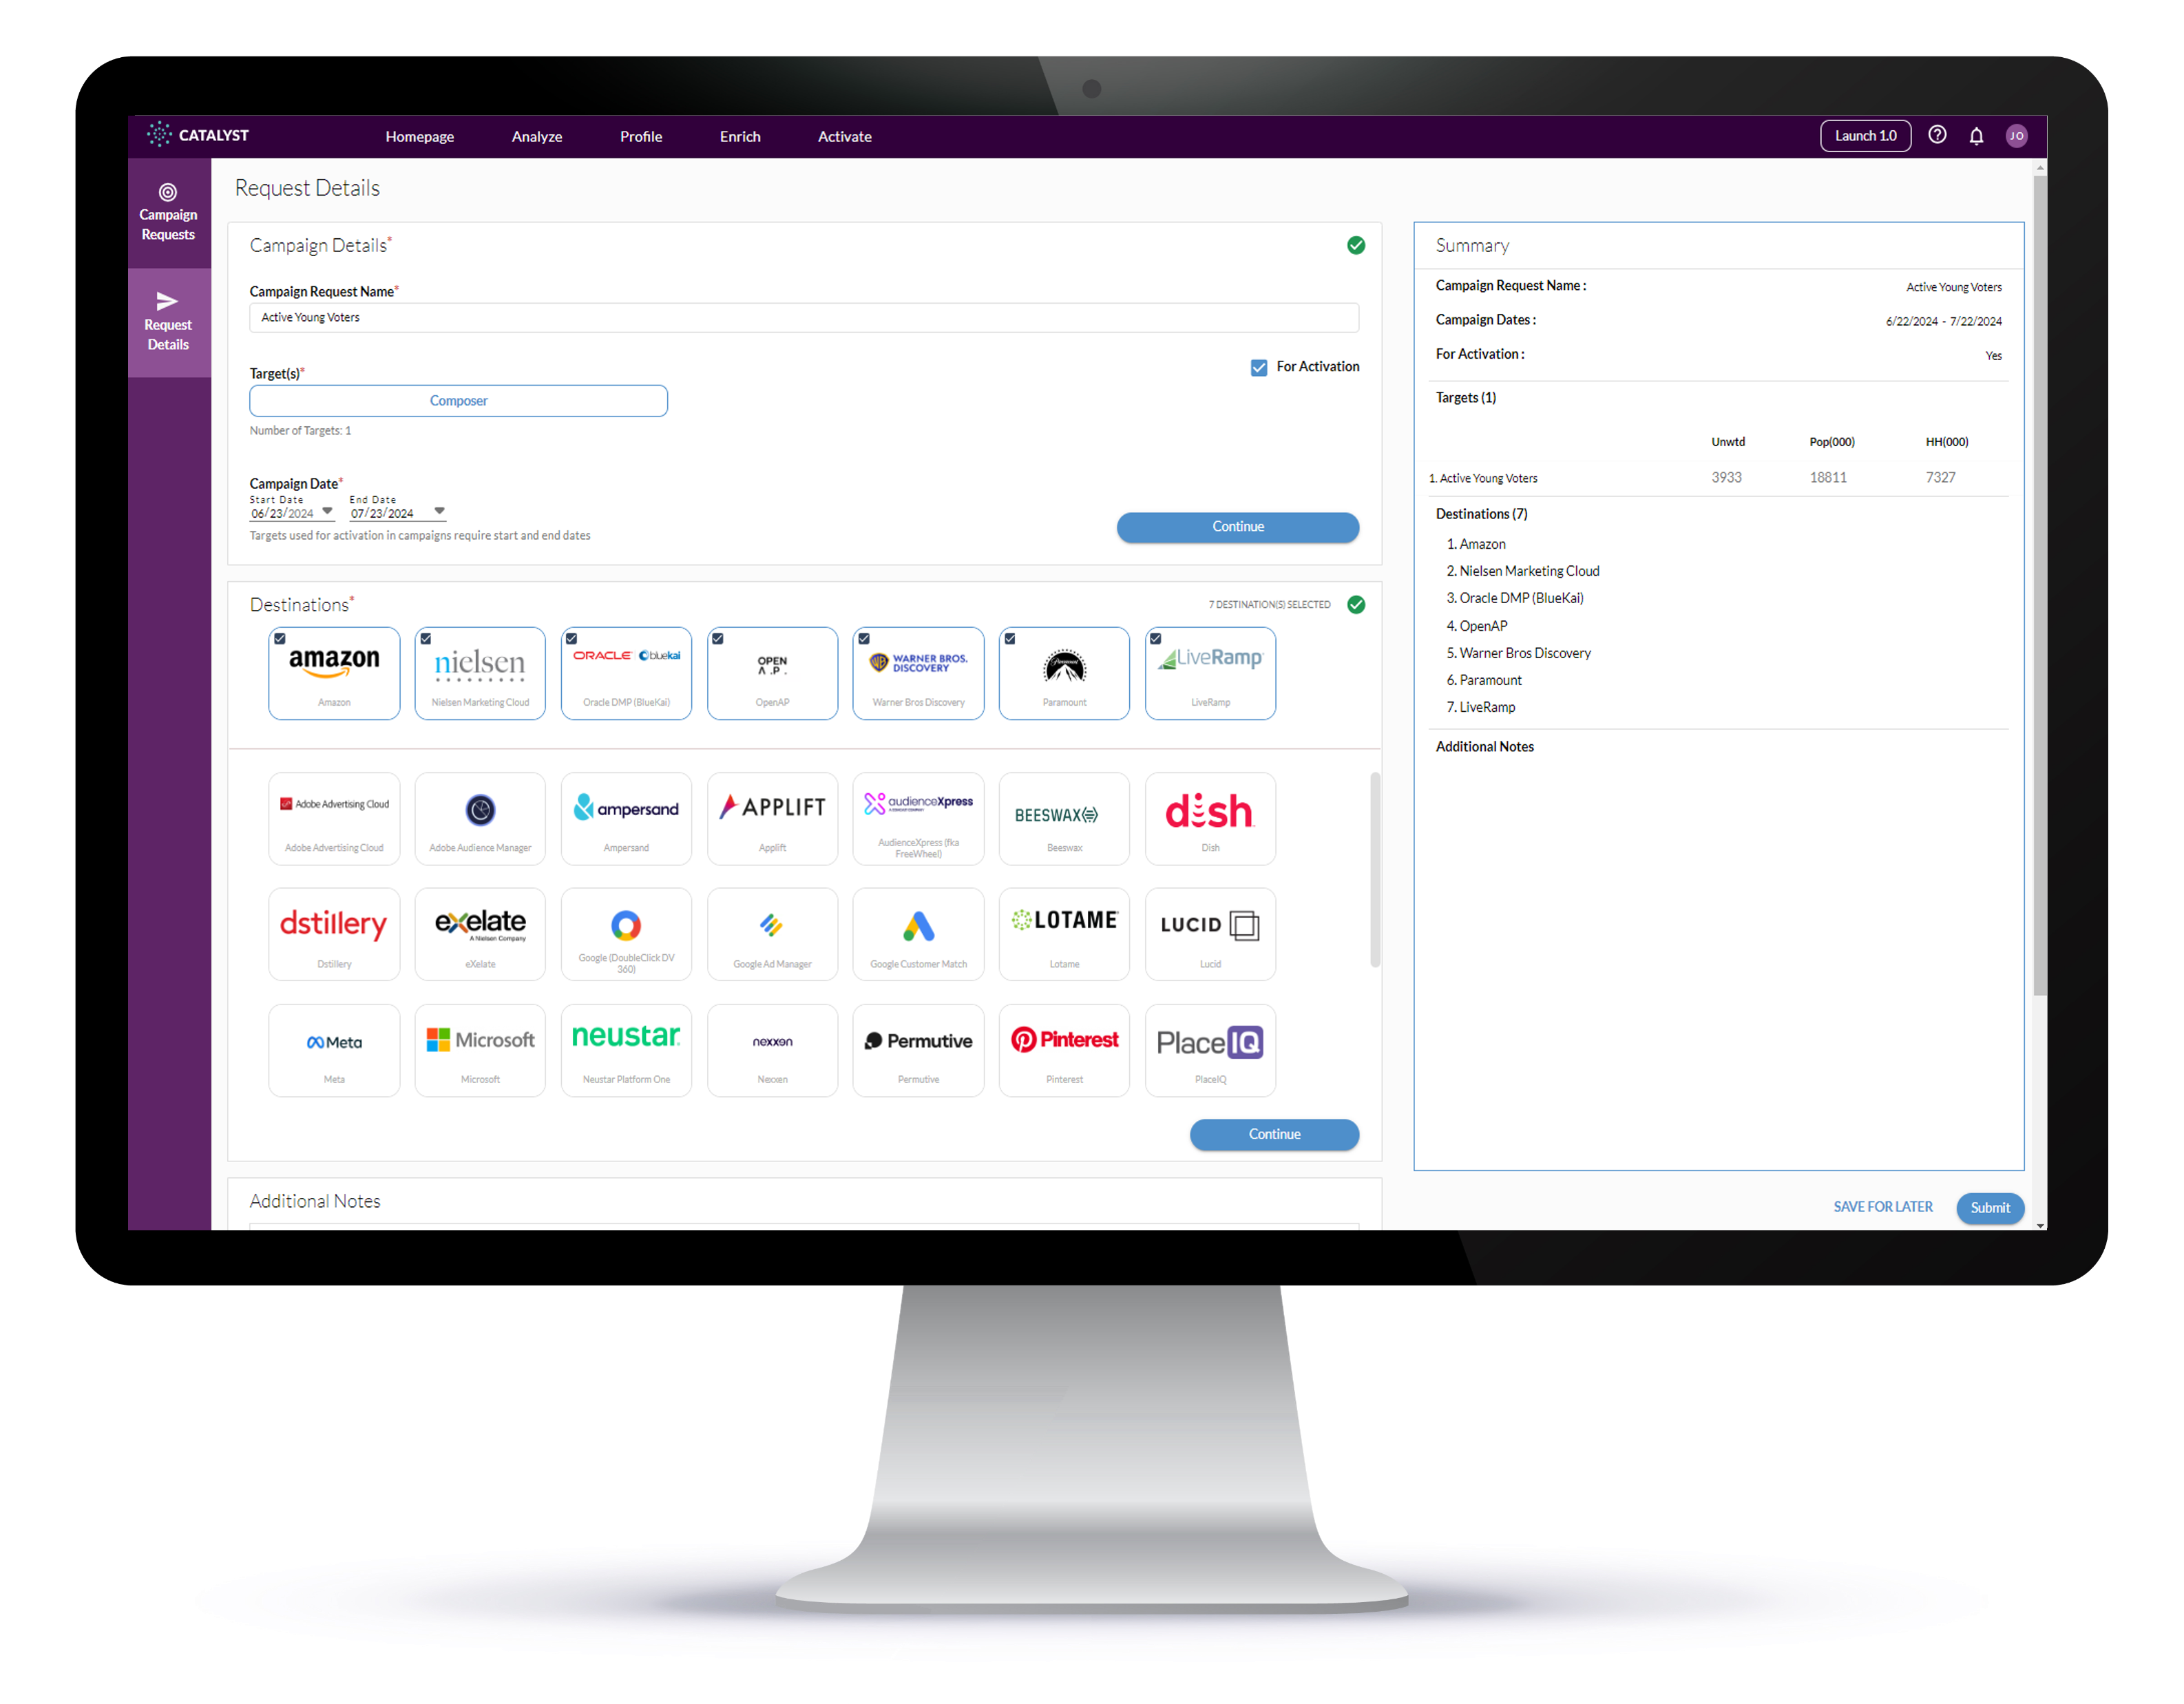
Through MRI-Simmons' activation solution, ACT, marketers can leverage trusted and nationally representative data to target and reach these registered voters, unregistered Americans, or new voter targets. Curate your audience with over 60,000 consumer elements: 1000+ attitudes and opinions, 6500+ brands in 1000+ product categories; and 90+ proprietary segments. Then, activate your audiences via the DMP, DSP, SSP, MVPD, or programmer of your choice.
Want to learn more about voters’ political and human rights attitudes? MRI-Simmons’ quarterly Trending Topics Study provides some of the most accurate data available on how American consumers feel about key “in the news” topics, what’s important to them when they vote, and how to reach them.
Contact us today to learn more.
Sources: 2024 Q2 Trending Topics Study (W24 USA); 2024 Winter MRI-Simmons USA.

