Let’s celebrate our canine and feline friends on National Pet Day!
Pets are an important part of many peoples' lives -- and our furry companions add a special presence to our lives, which was especially helpful during the isolating days of COVID. As George Eliot said, “Animals are such agreeable friends. They ask no questions; they pass no criticisms.” That's the kind of friend we all need. To celebrate National Pet Day on April 11, we decided to take a look at the households that own pets, based on the MRI-Simmons USA study.
According to the Winter 2022 study, 50% of US households own any kind of pet. Dogs are the most popular, in 38% of households, with cats coming in second at 24%. Some other stats include puppies (<1 year) in 3%, kittens (<1 year) also in 3%, with birds in about .6% and horses in .3%. Other pets (encompassing snakes, rodents, reptiles, and other species) are at 1.4% of US households.
Dog and cat ownership has remained relatively consistent over time, averaging about 41% of US households for dogs and 23% of US households for cats.
At a local level, the market most likely to have a dog is Sherman-Ada (Texas-Oklahoma) (54%; 139 index), while cats are popular in Clarksburg-Weston (West Virginia) (35%; 153 index). Puppies rule in Jonesboro (Arkansas) (6%; 174 index), and kittens are likely to be chilling out in Abilene-Sweetwater, Texas (6%; 216 index). Abilene-Sweetwater is also the market most likely to have any dog or cat at 64% (127 index). The markets least likely to have pets? For both dogs and cats, it is New York (25%; 63 index for dogs and 16%; 70 index). Chicago is the least likely place for puppies and kittens (2%; 59 index for puppies and 2%; 61 index for kittens).
Breaking this down to the state level, Wyoming leads the pack for dog/cat ownership in general, with 65% of household owning either a dog or a cat (index: 128), as well as any dog (53%; 135 index) and any puppy (6%; 157 index), while Vermont holds the top spot for cats (34%; 147 index), and households in Arkansas are more likely to have kittens – nearly twice as likely as the continental US in general (5%; 190 index). As far as where pets are least likely to live, Washington DC holds the leash on that across the board.
And our pets are spoiled. 76% of pet-owning households have purchased treats for their dog or cat in the last 6 months; these same households have spent a mean of $319 on food in the last year, and $1096 on veterinary care for their pets in the same time frame. Man’s best friend gets more pampered treatments too – 32% of dog-owning households have visited the groomer in the last year, 10% have used a boarding service, 5% have used doggy day care, and 3% have invested in training.

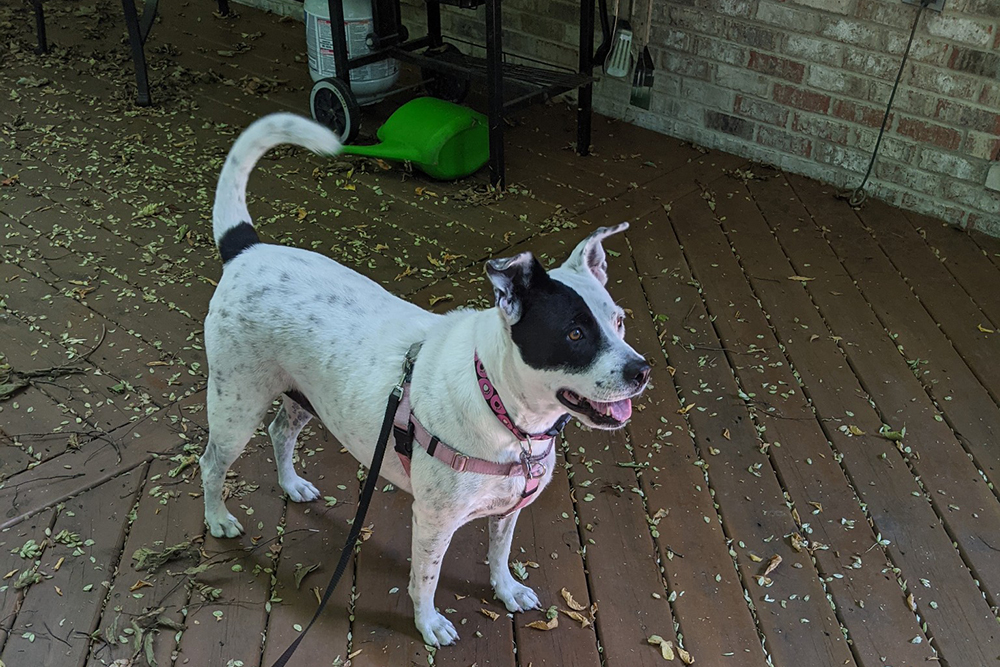
Dani Lonestar (above) and I hope you and your pets have a great National Pet Day! To learn more about pets and the households they live in, along with the 60,000 other data points measured in the MRI-Simmons USA study, contact us here.


